
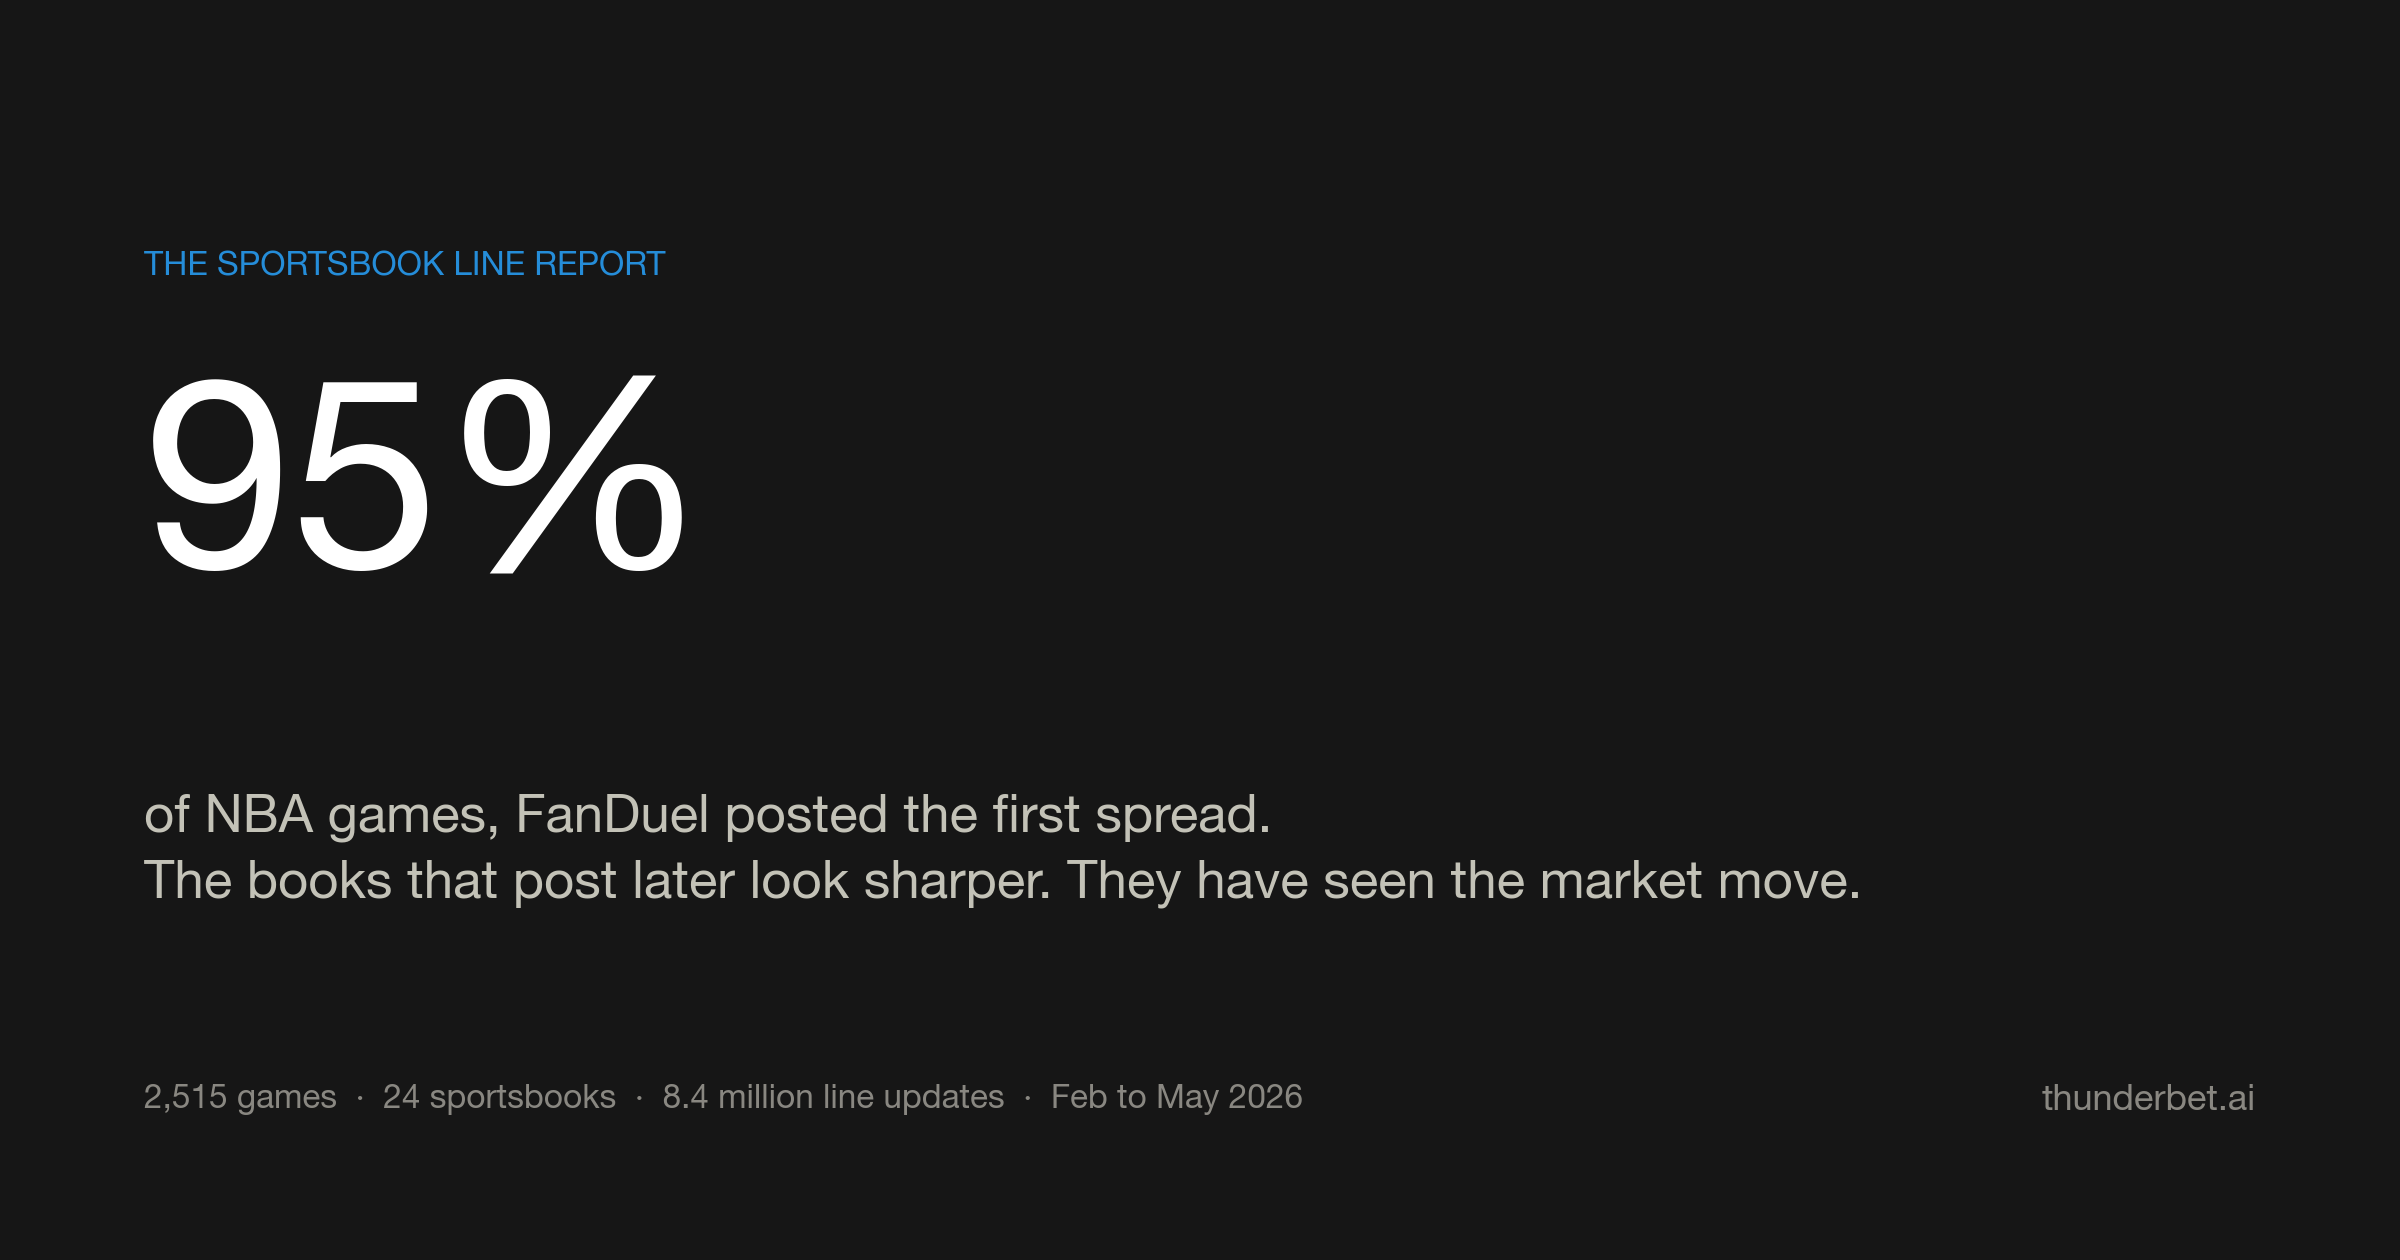
Every bettor has an opinion about which sportsbook is "sharp." We had the data to check. ThunderBet records every line change at every book we track, so we pulled six months of it and asked four simple questions: who posts the number first, whose opener is closest to where the market ends up, whose closing number disagrees with everyone else, and which books are quietly the same book.
The dataset: 2,515 games (NBA, NHL, MLB, and men's college basketball from February 28 to May 29, 2026), 24 sportsbooks, 145,000 individual lines, and 8.4 million recorded line updates. Plus a fresh look at NFL Week 5 for the one question the archived data can't answer cleanly.
The five findings
- FanDuel posts the first NBA spread on 95% of games. DraftKings is within ten minutes on 73%. Most offshore books post hours later.
- Going first costs about a quarter of a point. The books whose openers land closest to the close are the ones that post last. They look sharp because they've already seen the market move.
- Before kickoff, Pinnacle moves its NFL spread about three times as often as DraftKings and FanDuel. Circa barely touches its number.
- The newer US books disagree with the market most at close. On NHL and MLB totals, ESPN BET, Fanatics, Hard Rock and Fliff sit half a run or goal off the rest of the market on roughly 40% of games.
- Five books are really two. Bally Bet, betPARX and BetRivers post identical closing NBA spreads 95 to 98% of the time. BetOnline and LowVig, 94%.
1. FanDuel sets the NBA number
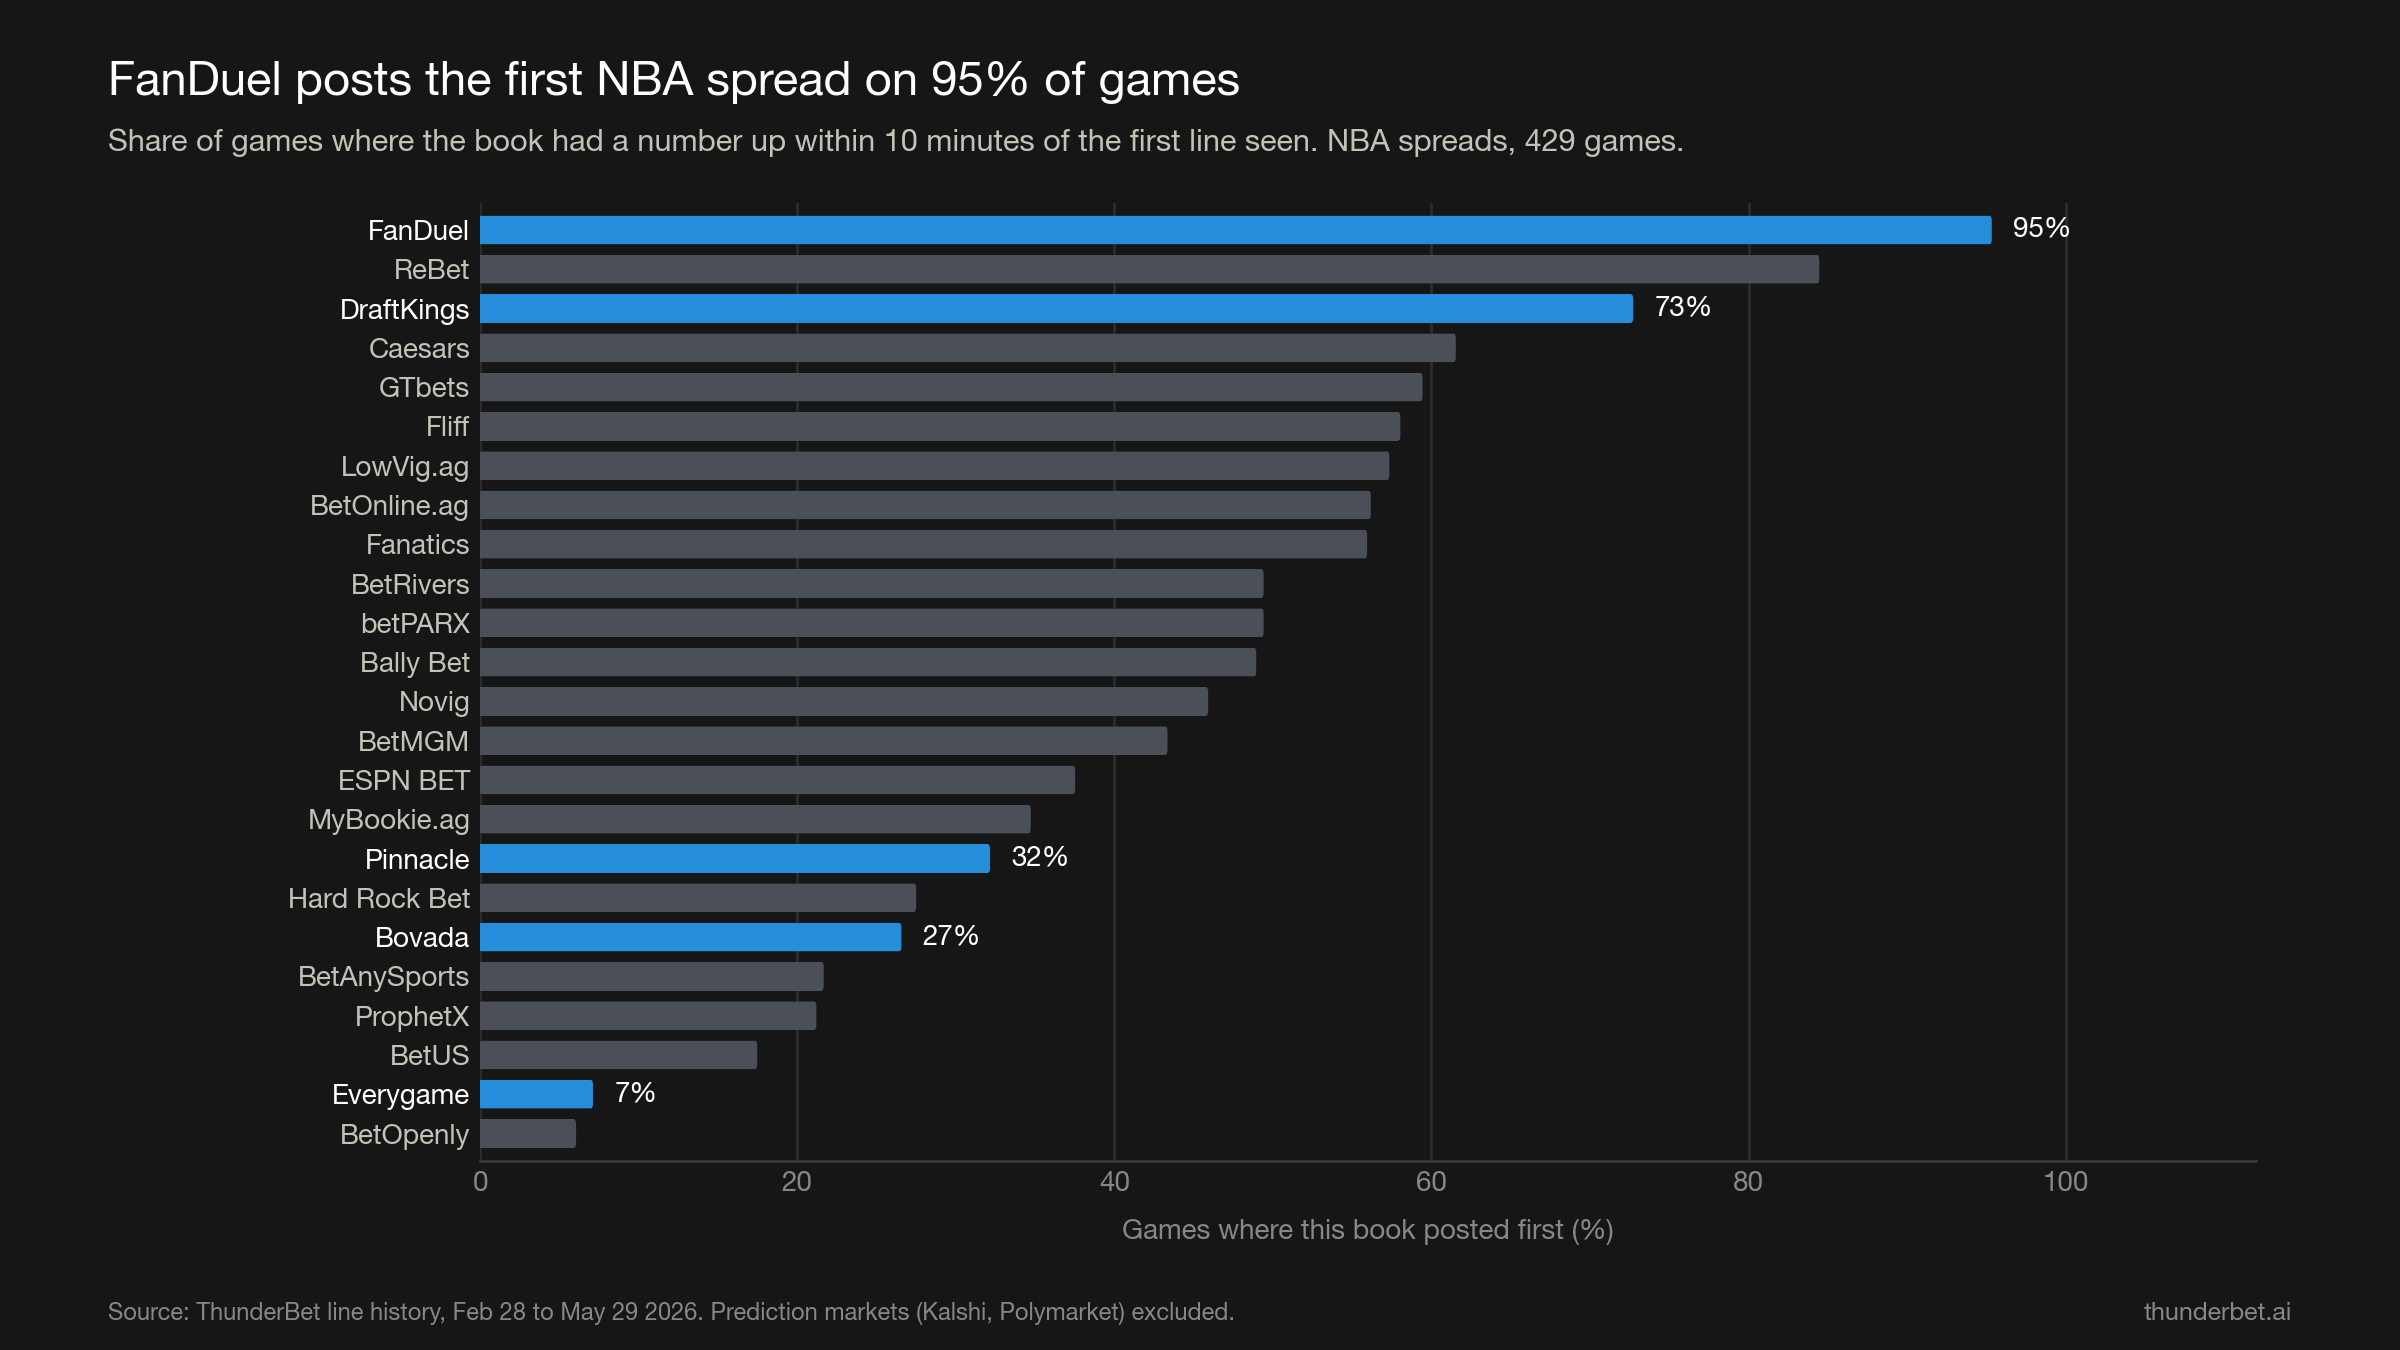
On 95% of NBA games, FanDuel's spread was the first number on the board. DraftKings was there within ten minutes on 73% of games, Caesars on 62%. Pinnacle, the book everyone calls the market maker, was first on just 32%.
The same pattern holds in baseball: FanDuel posted the first MLB total on 95% of games, with Fliff, Fanatics, BetOnline and LowVig close behind. In the NHL, DraftKings took the lead (55% of games), with Fanatics and FanDuel next. In college basketball, BetOnline and LowVig were first on 80% of games.
The NFL is its own animal. DraftKings and Caesars had a Week 5 spread posted roughly two months before kickoff, as part of their look-ahead lines. FanDuel followed about 12 days out. Most books posted inside a week.
Meanwhile the offshore books, Bovada (27%), BetAnySports (22%), BetUS (18%), Everygame (7%) and the peer-to-peer BetOpenly (6%), consistently post after everyone else. That matters for the next finding.
2. Going first costs about a quarter of a point
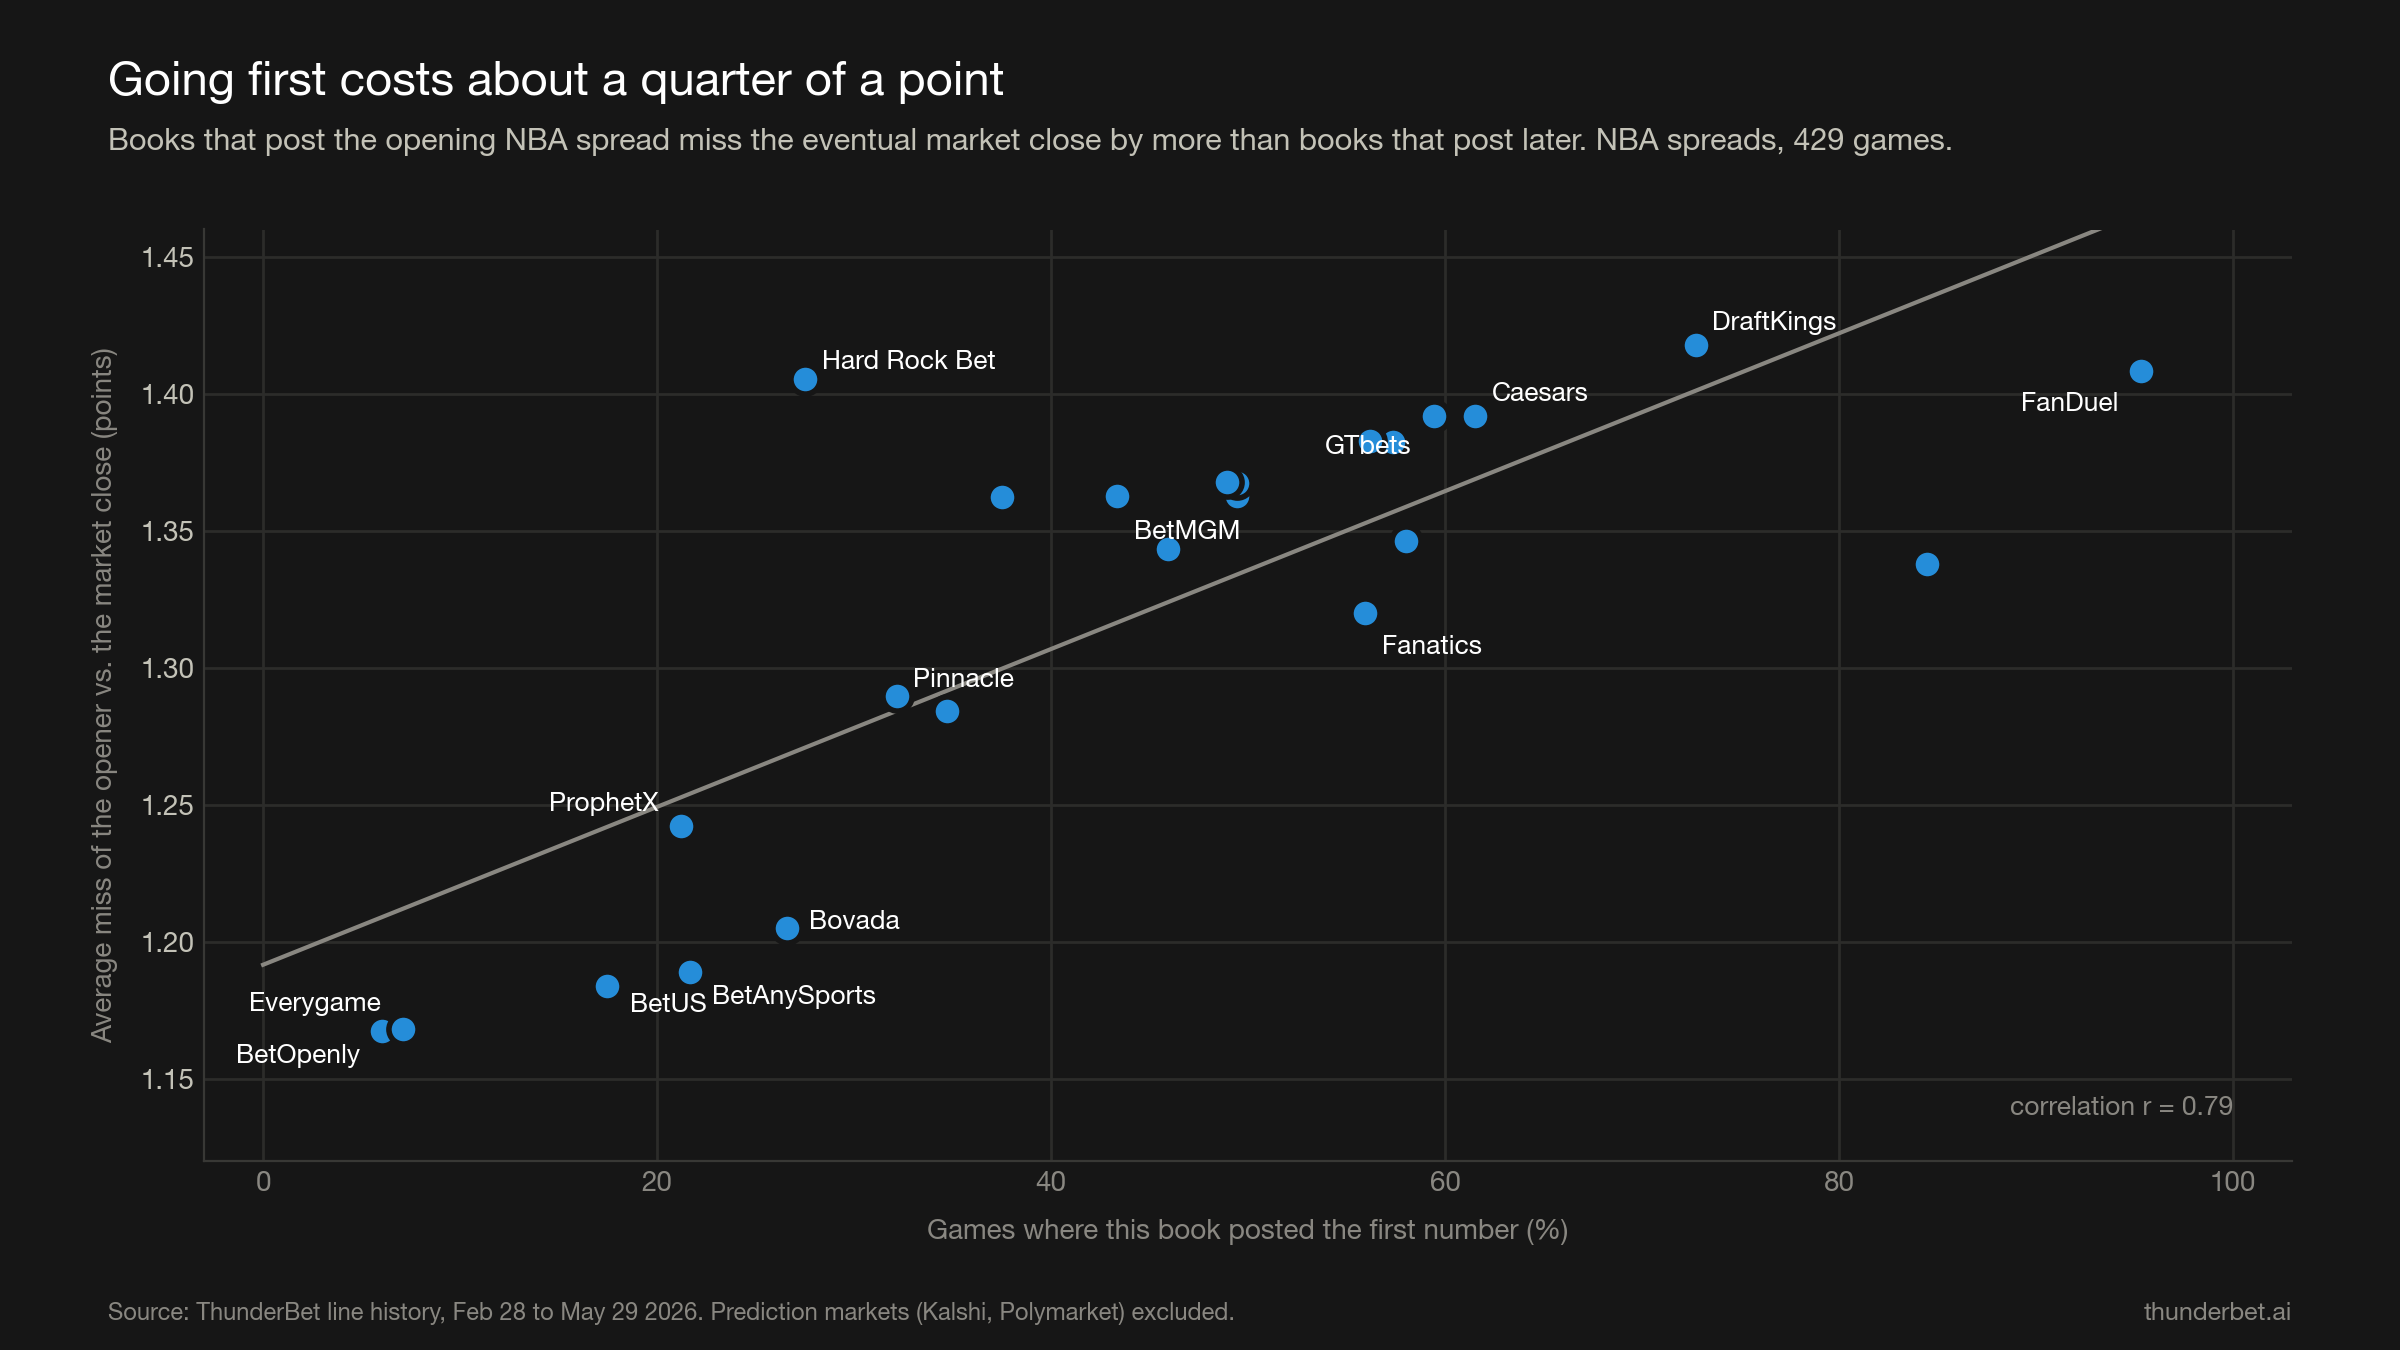
Here is the ranking a naive "who has the sharpest opener" study would produce for NBA spreads: BetOpenly and Everygame (1.17 points from the eventual close on average), BetUS (1.18), BetAnySports (1.19), Bovada (1.21). At the bottom: Caesars (1.39), Hard Rock (1.41), FanDuel (1.41), DraftKings (1.42).
Line that up against who posts first and the story flips. The "sharpest" openers belong to the books that post last. The correlation between how often a book posts first and how far its opener misses is 0.79. The books that originate the number eat about a quarter of a point of information cost; the books that wait get to copy a number the market has already pushed.
Directional accuracy says the same thing. When a book's opener disagreed with the market's opening consensus, the late posters were on the side the market eventually moved toward 65 to 71% of the time (BetOpenly 71%, Everygame 69%, BetAnySports 68%, Bovada 67%). FanDuel was right 46% of the time and DraftKings 48%, which is what you'd expect from a book that is posting before there is a market to be right about.
What this means if you bet: the opener at FanDuel or DraftKings is, on average, the softest version of the number you will see all day. If you have a read on a game, that is the number to beat, and it is only up early at the books that originate.
3. Pinnacle moves its number three times as often before kickoff
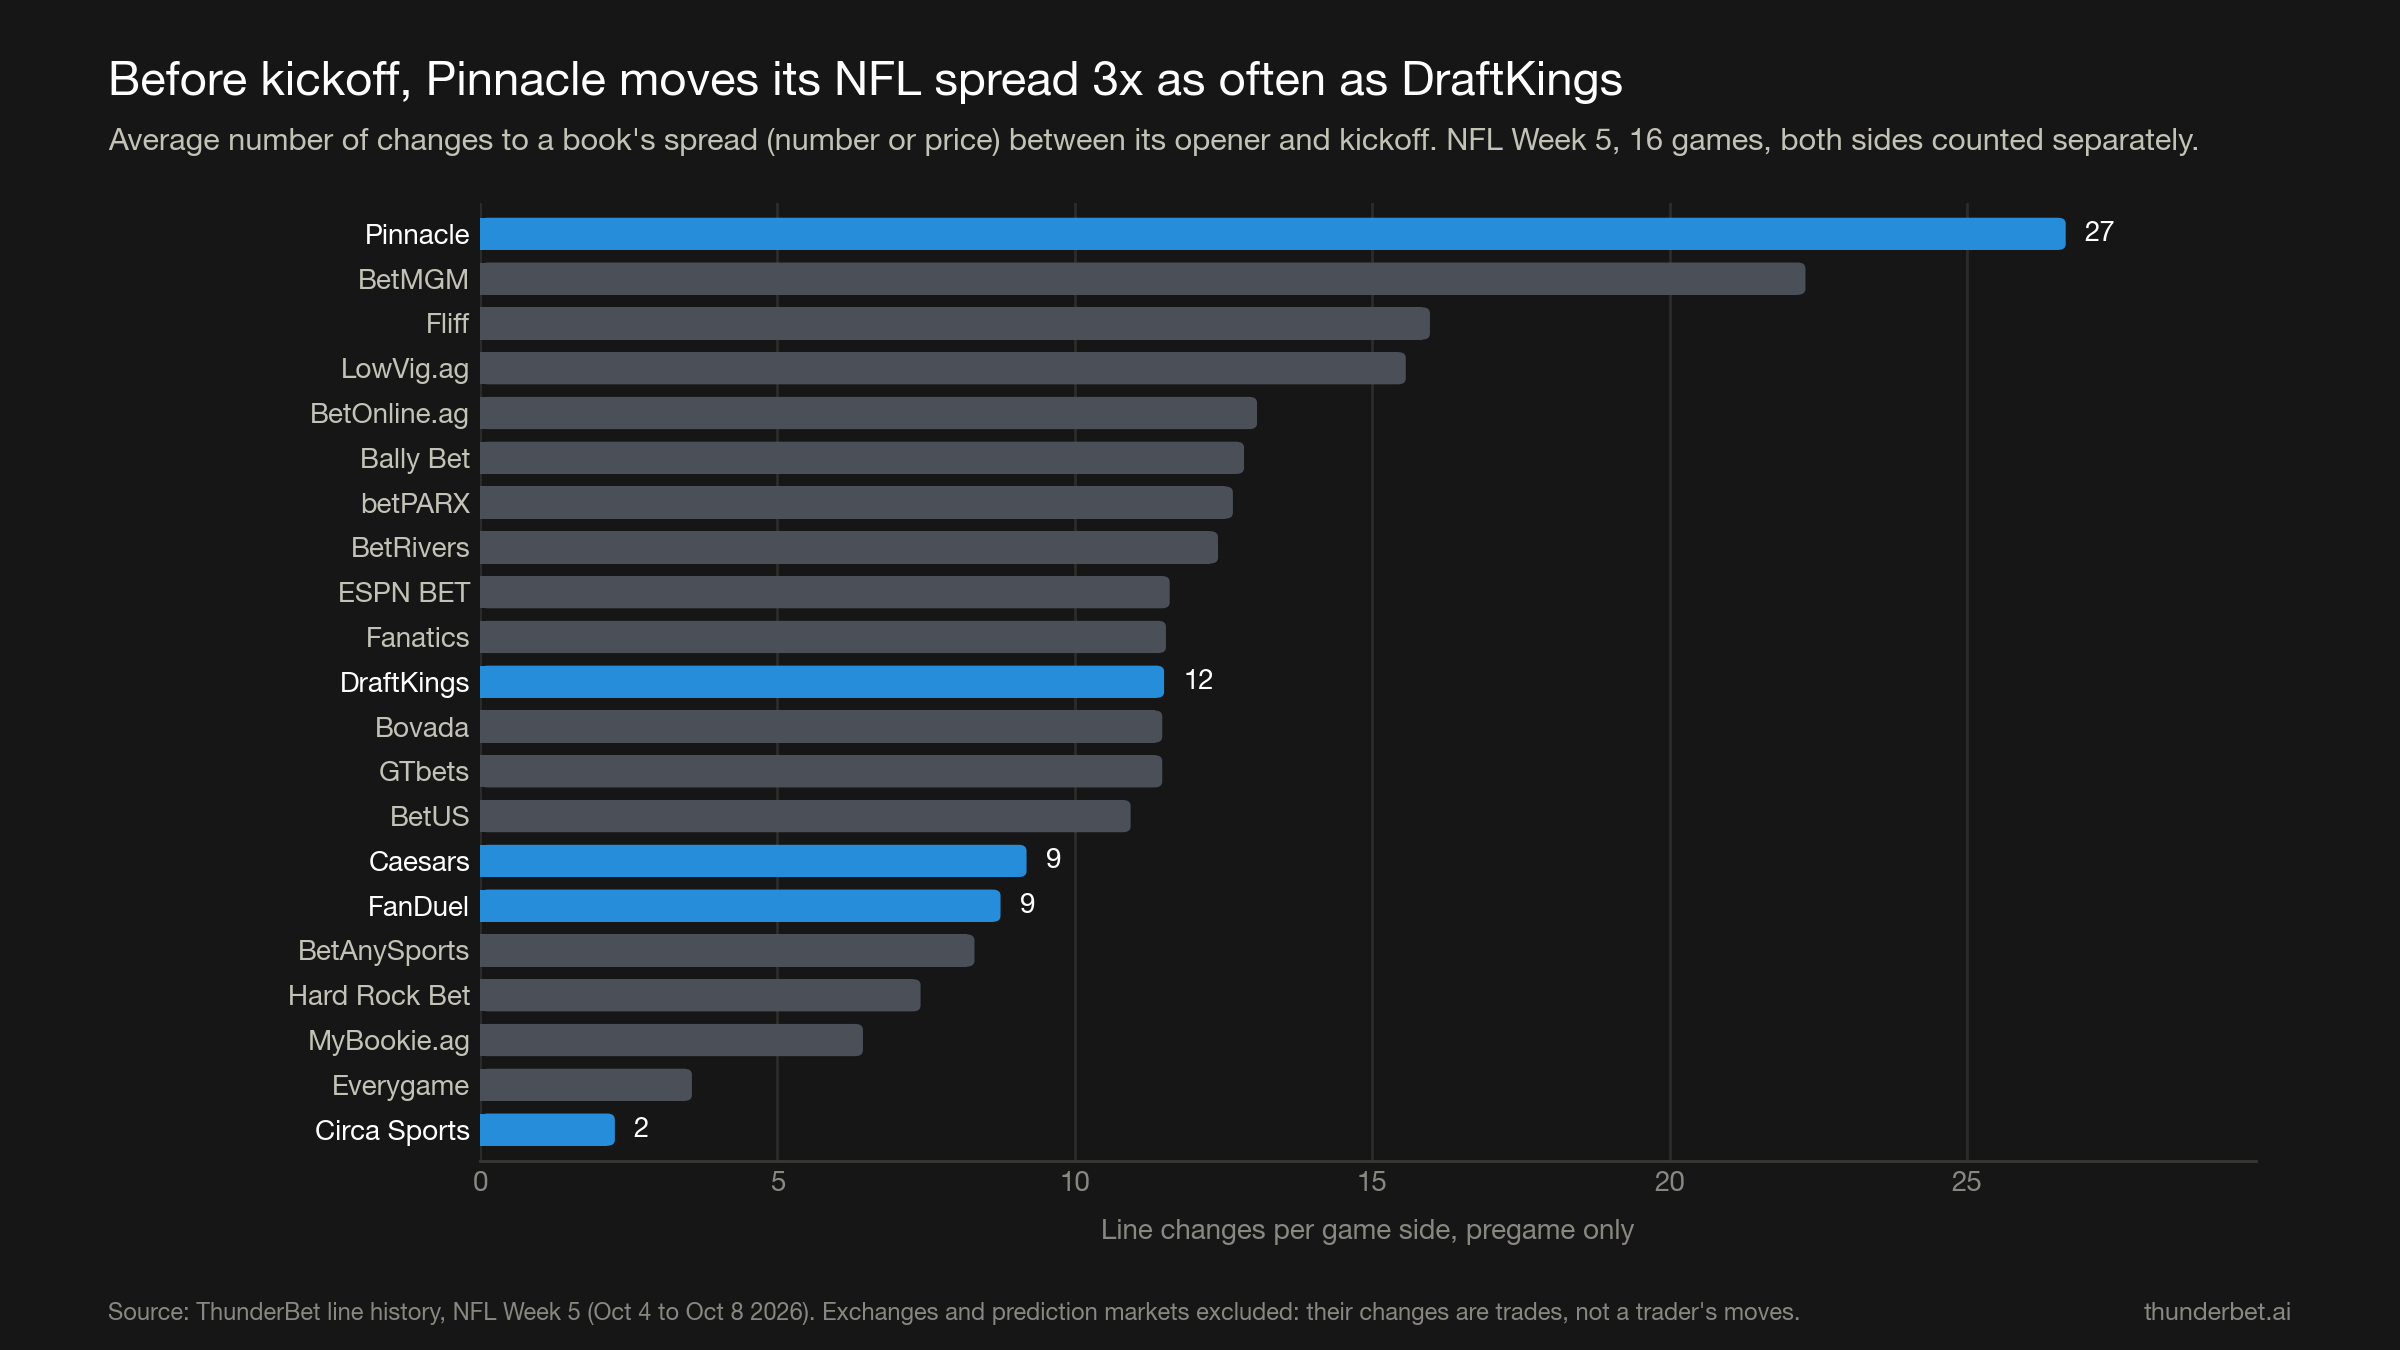
Our archived data for the spring sports includes in-play updates, which would make any "who moves most" comparison a live-betting contest. So for this question we used the raw pregame feed from NFL Week 5 (October 4 to 8, 2026), 16 games, counting only changes before kickoff.
Pinnacle changed its spread, the number or the price, 27 times per side before kickoff. BetMGM was next at 22. DraftKings changed 12 times, Caesars 9, FanDuel 9. Circa Sports, the Las Vegas book with a sharp reputation, changed about twice.
Counting only moves of the actual number (not the price): Pinnacle 6.3, Caesars 5.9, the Kambi books (Bally Bet, betPARX, BetRivers) 5.3, DraftKings 4.9, FanDuel 2.4, Circa 0.8.
Two readings are both true. Pinnacle manages its number continuously, which is why its line is the one worth watching for movement. And FanDuel, the book that posts first, barely moves its number once it is up: it originates, then holds.
One honest caveat: sixteen games is a small sample for ranking books that are close to each other. It is plenty for the gap between 27, 12 and 2.
4. Where the market disagrees at close
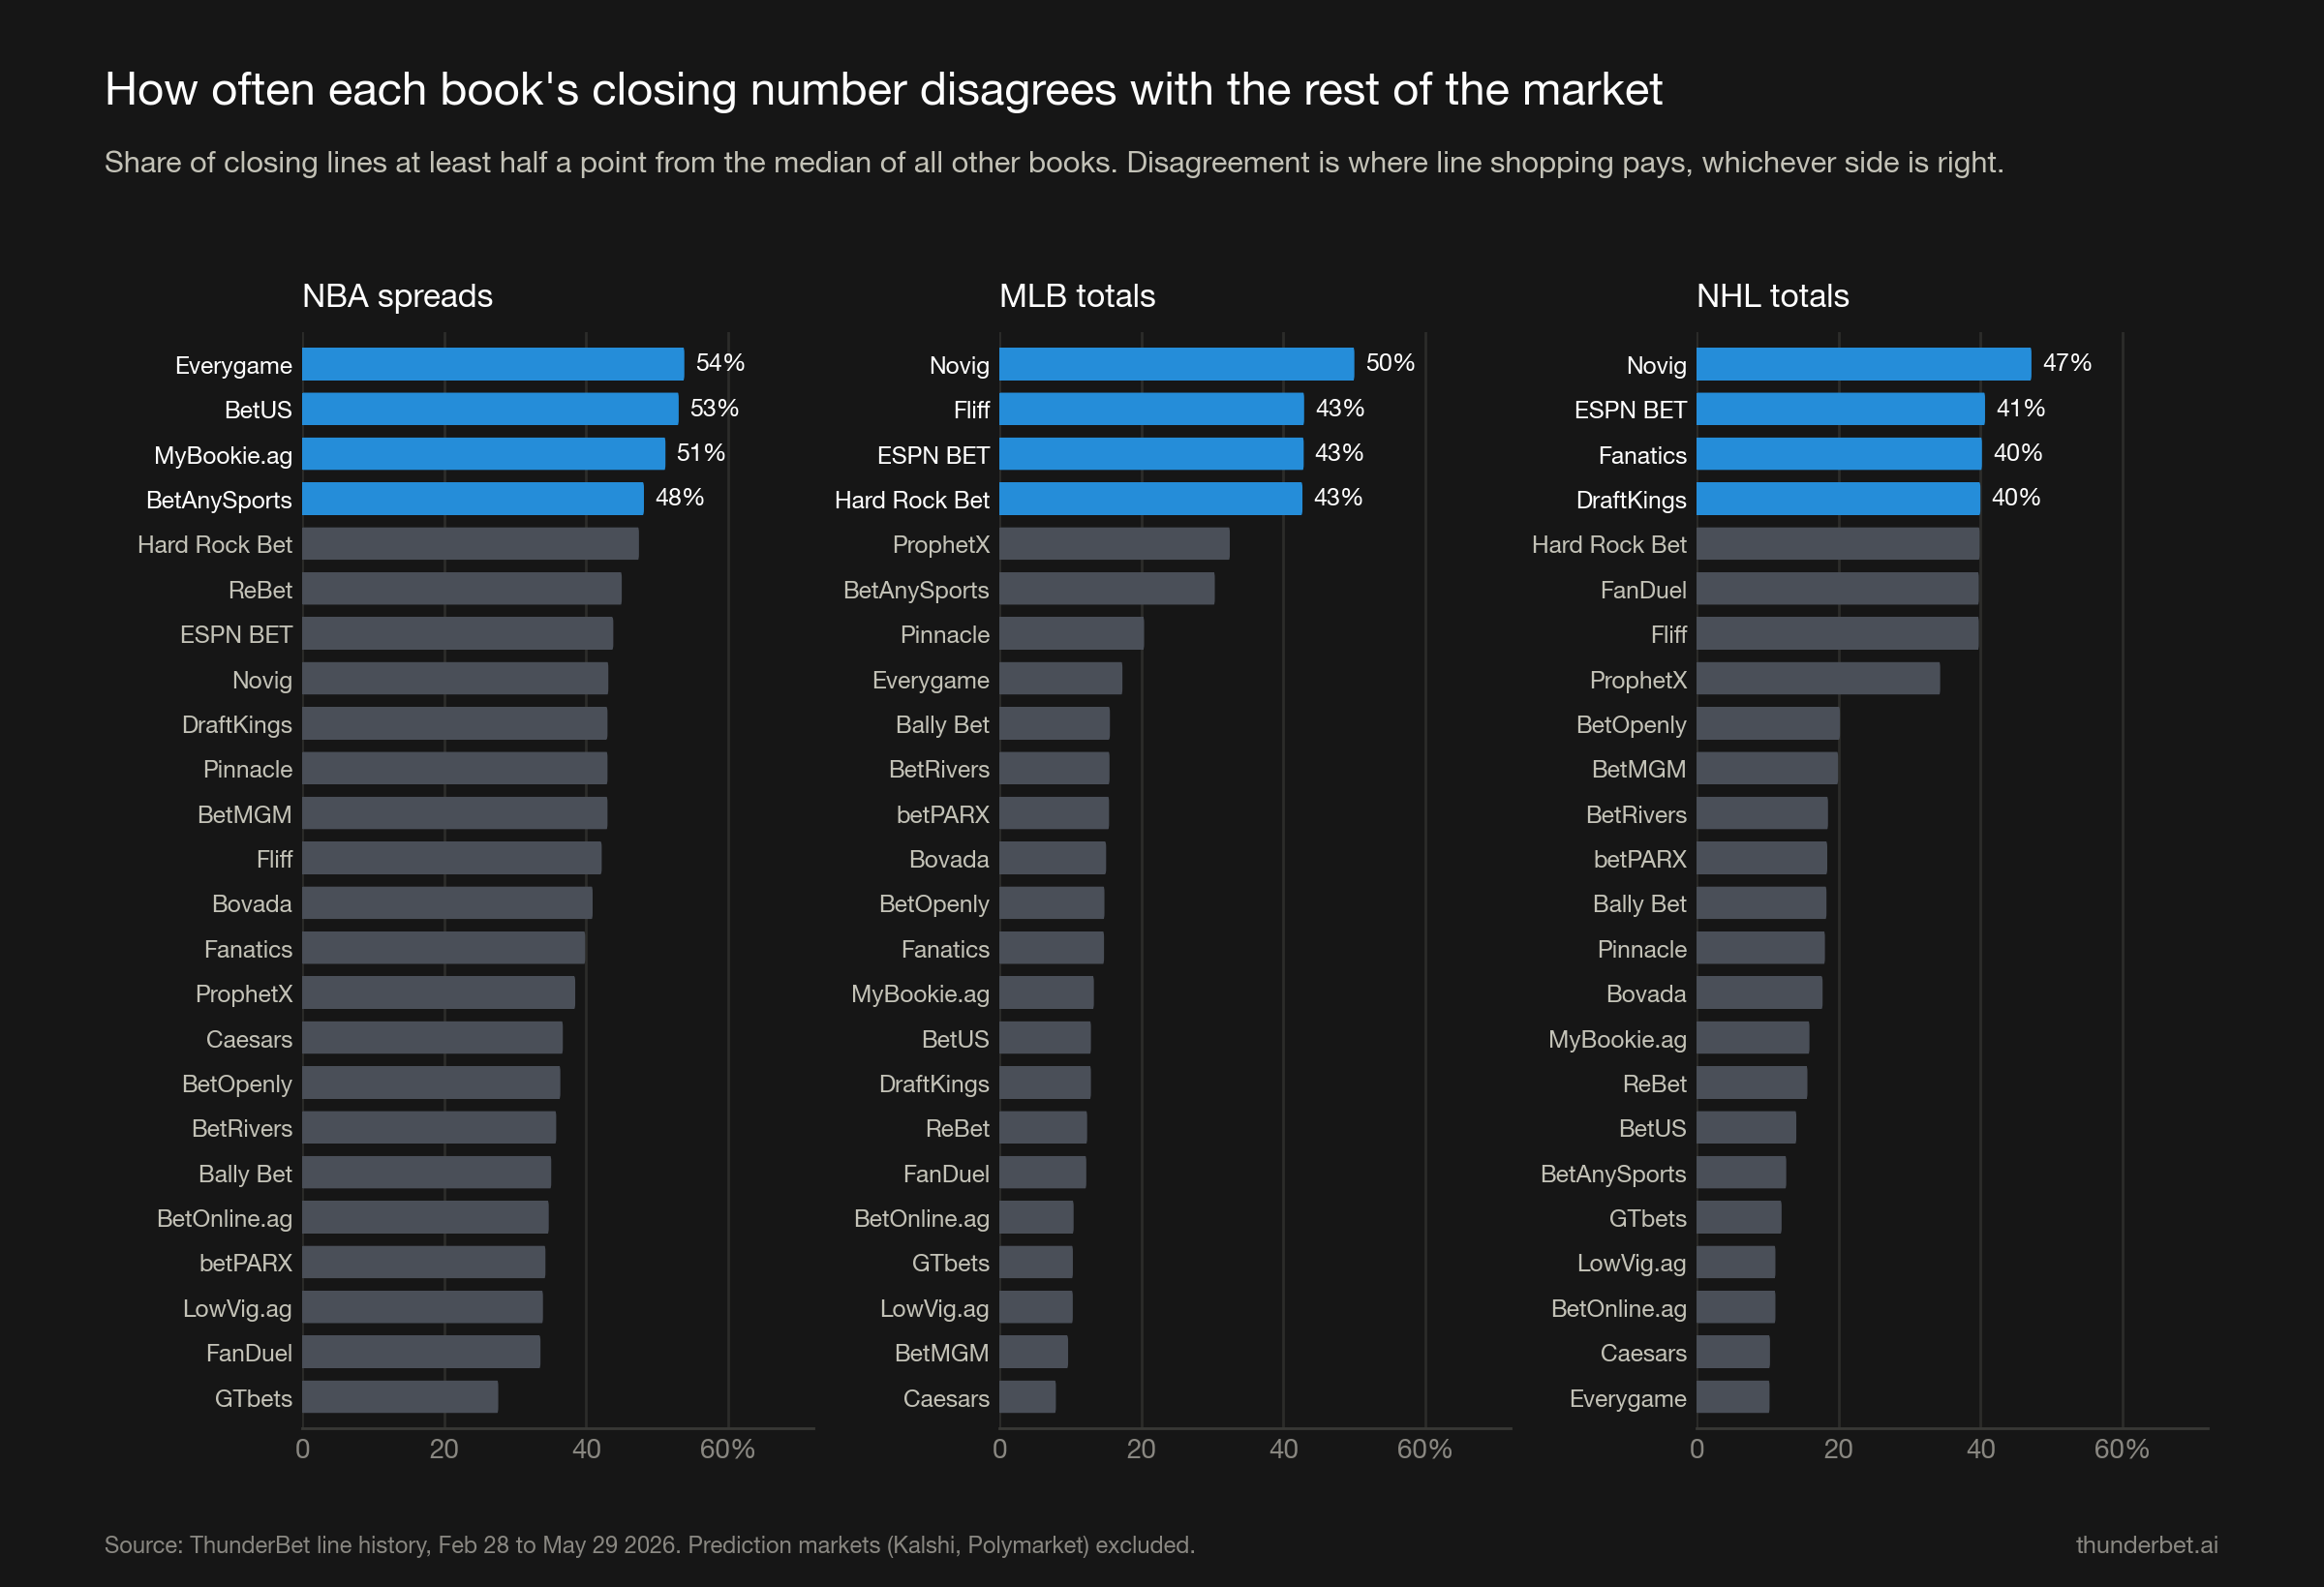
At close, how often does a book's number differ from the rest of the market by at least half a point? This isn't a measure of being wrong. It is a measure of where line shopping has something to shop.
NBA spreads: the offshore cluster is off the market by half a point or more on about half of all games (Everygame 54%, BetUS 53%, MyBookie 51%, BetAnySports 48%). The Kambi books, FanDuel and GTbets hug the consensus most tightly (28 to 36%).
MLB totals: a sharp split. Caesars (8%), BetMGM (10%), LowVig, GTbets and BetOnline (10 to 11%) almost never leave the market number. ESPN BET, Fliff and Hard Rock disagree on 43% of games, and the exchange Novig on 50%.
NHL totals: the same split, with the big US brands on the disagreeing side. ESPN BET (41%), Fanatics (40%), DraftKings (40%), FanDuel (40%), Hard Rock and Fliff (40%) were half a goal off the rest of the market on two games in five. Everygame, Caesars, BetOnline and LowVig stayed within a half goal on about 90%.
Since NHL totals live on 5.5, 6 and 6.5, "half a goal off" means these books are routinely posting 6.5 when the market is at 6, or the reverse. Whichever side is right, that is a real price difference, and it is sitting there at the books most people already have accounts with.
5. Five books are really two
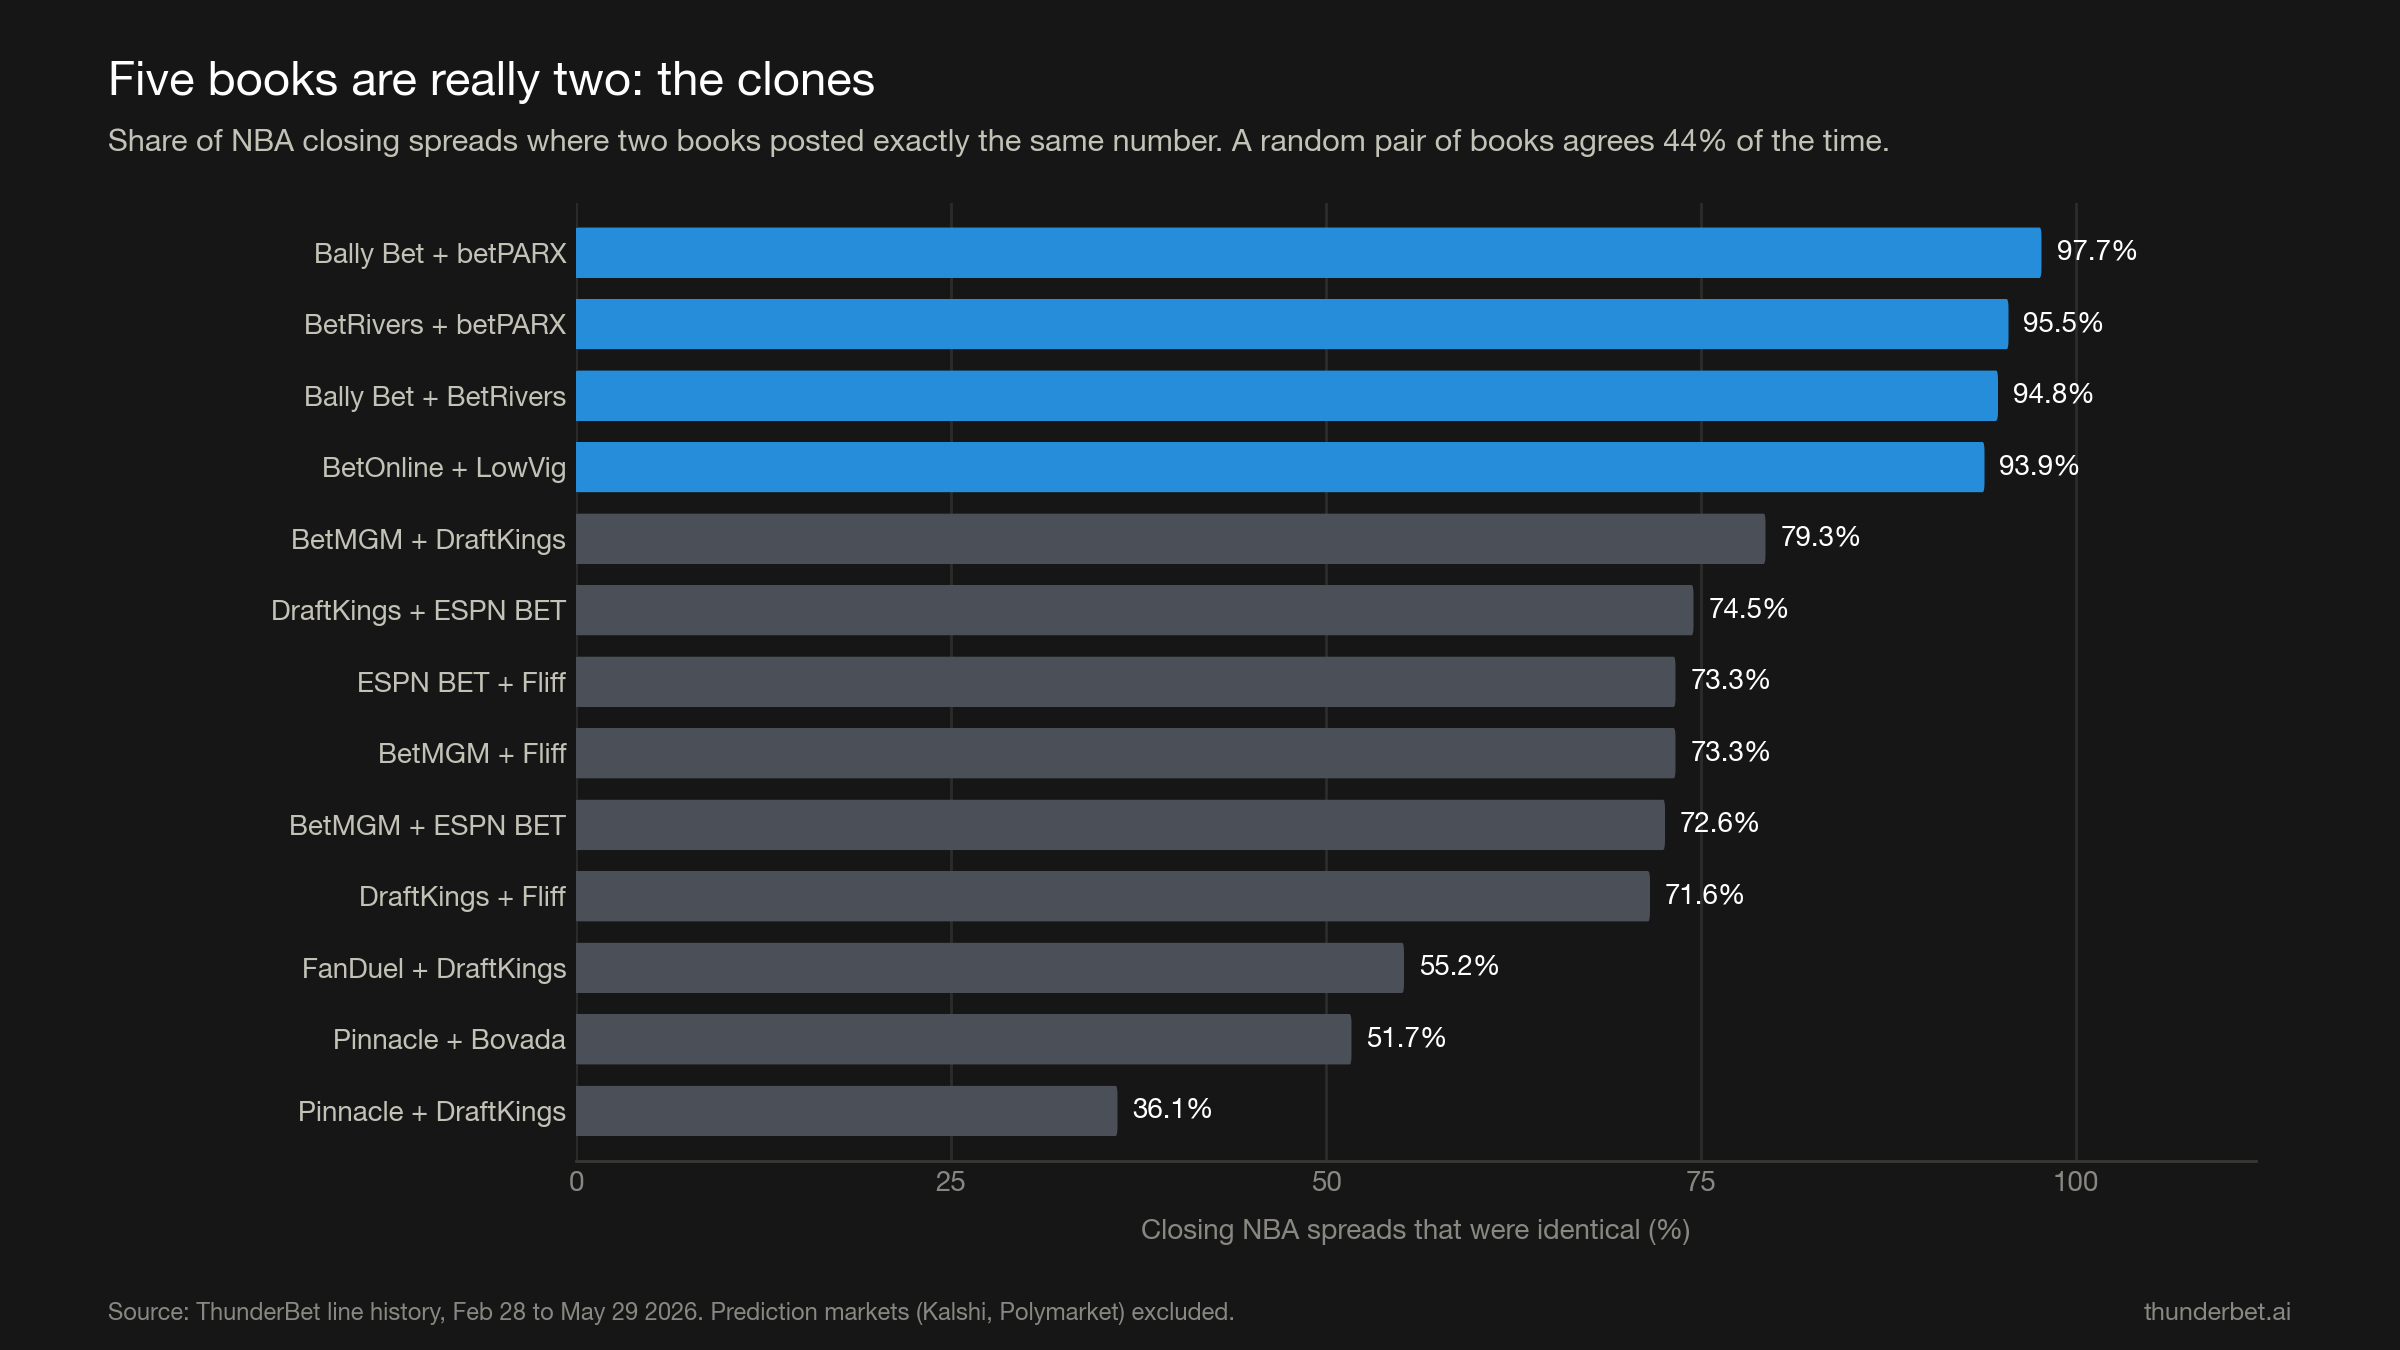
Bally Bet, betPARX and BetRivers posted the exact same closing NBA spread on 95 to 98% of games. In MLB totals it is 98 to 99%. All three run on Kambi's trading platform; for line-shopping purposes they are one book with three logos.
BetOnline and LowVig, which share an owner, matched on 94% of NBA spreads and 99% of MLB and NHL totals.
For contrast, a random pair of books agrees on the closing NBA spread 44% of the time. DraftKings and BetMGM match 79% of the time, which is high but is the normal amount of "everyone is looking at the same market." Pinnacle and DraftKings match on 36%.
What to do with this
- Shop the disagreement, not the logo count. Bally Bet, betPARX and BetRivers are one price. BetOnline and LowVig are one price. Your "five books" may be three.
- The originator's opener is the soft number. If you want a number before the market has pushed it, it is up at FanDuel and DraftKings first, and those books pay a quarter point for the privilege.
- Watch Pinnacle for movement, not for the opener. It rarely posts first, but once the number is up it is the book that keeps trading it.
- On NHL and MLB totals, check the newer US books against the market. ESPN BET, Fanatics, Hard Rock and Fliff are half a goal or run off the consensus on 40% of games.
Methodology
ThunderBet records every odds change at every book in one pass, so every book is sampled at the same moment. For the spring data we used our archived per-game summaries, which keep each book's first and last pregame number for every side of every spread and total. Period: February 28 to May 29, 2026. Games: NBA 429, college basketball 786, MLB 841, NHL 459.
- First on the board: a book had a number up within ten minutes of the earliest number any tracked book posted for that game. Games enter our collector about a day before tip for NBA, NHL and MLB and about a week out for the NFL, so "first" means first among the books we watch from the moment we start watching.
- Market close: the median closing number of all other books (leave-one-out), so no book is graded against itself.
- Opener miss: absolute distance in points between a book's first number and the market close, averaged over every side it priced.
- Directional accuracy: when a book's opener differed from the market's median opener, how often the market close was on the book's side.
- Disagreement at close: share of a book's closing lines at least 0.5 from the leave-one-out median.
- Clones: share of sides where two books' closing numbers were identical.
- NFL changes: raw pregame feed, NFL Week 5 (Oct 4 to 8, 2026), 16 games, counting each change in a book's point or price per side. Exchanges and prediction markets (ProphetX, Novig, BetOpenly, Kalshi, Polymarket) are excluded from this chart because their "changes" are trades, not a trader's decisions.
- Exclusions: Kalshi and Polymarket are excluded throughout; their spread markets are listed at fixed strikes, so an "opener" six points from the close is a product design, not a sharpness signal. Books with fewer than 200 lines in a sport were dropped. NFL was excluded from the spring block because our archived NFL rows for that window were incomplete.
Prices and points are as delivered to us by the books' public feeds. If you want the per-book tables for a sport we didn't chart, email support@thunderbet.ai and we'll send them.
Appendix: NBA spreads, all books
| Book | First on board | Opener miss (pts) | Direction right | Off market at close |
|---|---|---|---|---|
| FanDuel | 95% | 1.41 | 46% | 34% |
| ReBet | 84% | 1.34 | 53% | 45% |
| DraftKings | 73% | 1.42 | 48% | 43% |
| Caesars | 62% | 1.39 | 42% | 37% |
| GTbets | 59% | 1.39 | 41% | 28% |
| Fliff | 58% | 1.35 | 55% | 42% |
| LowVig | 57% | 1.38 | 52% | 34% |
| BetOnline | 56% | 1.38 | 52% | 35% |
| Fanatics | 56% | 1.32 | 58% | 40% |
| BetRivers | 49% | 1.36 | 52% | 36% |
| betPARX | 49% | 1.37 | 51% | 34% |
| Bally Bet | 49% | 1.37 | 51% | 35% |
| Novig | 46% | 1.34 | 56% | 43% |
| BetMGM | 43% | 1.36 | 51% | 43% |
| ESPN BET | 38% | 1.36 | 53% | 44% |
| MyBookie | 35% | 1.28 | 56% | 51% |
| Pinnacle | 32% | 1.29 | 60% | 43% |
| Hard Rock Bet | 28% | 1.41 | 55% | 47% |
| Bovada | 27% | 1.21 | 67% | 41% |
| BetAnySports | 22% | 1.19 | 68% | 48% |
| ProphetX | 21% | 1.24 | 61% | 38% |
| BetUS | 17% | 1.18 | 65% | 53% |
| Everygame | 7% | 1.17 | 69% | 54% |
| BetOpenly | 6% | 1.17 | 71% | 36% |
ThunderBet tracks these moves as they happen: which book moved, by how much, and whether the rest of the market followed. If that's the read you want on tonight's slate, the Odds Drop detector is where it lives. The numbers above were produced with the same feed; the analysis scripts are in our repository and we're happy to share them.